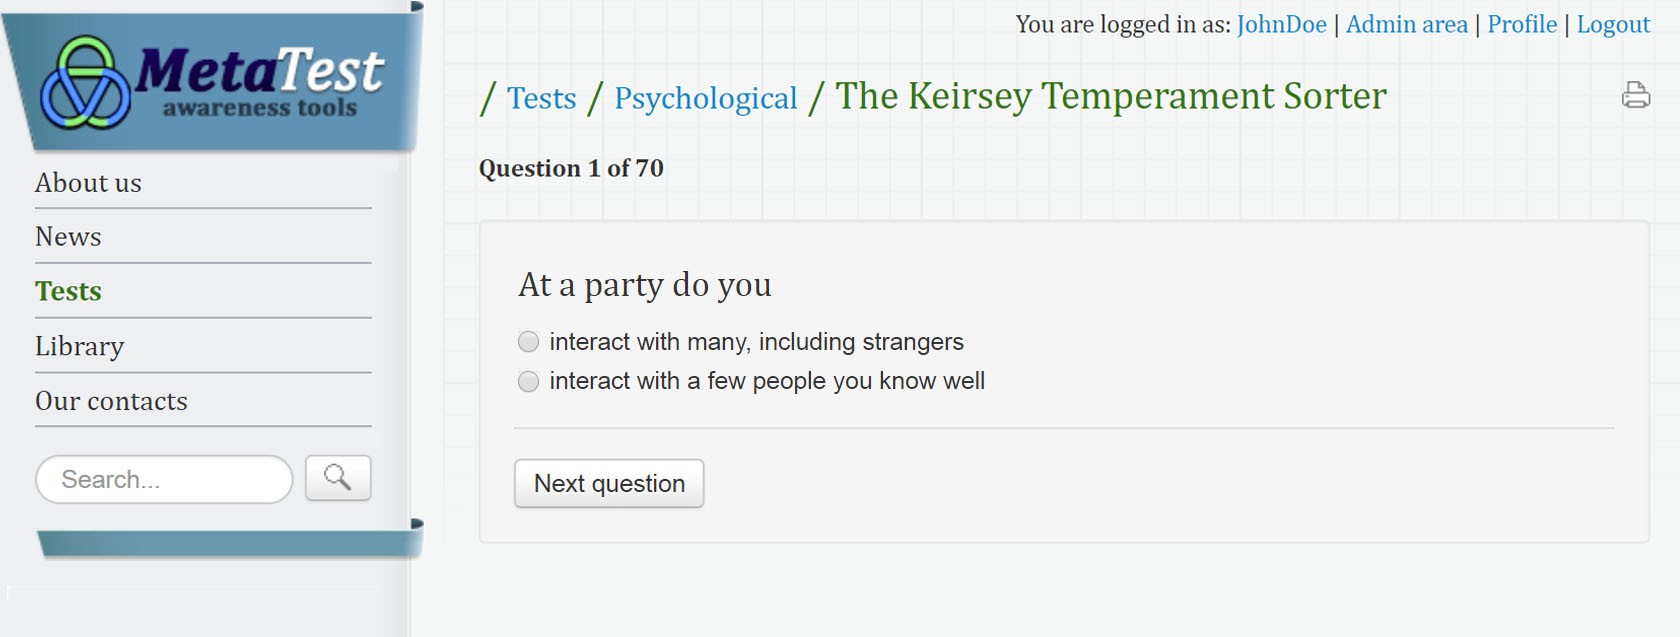
The client appeared without a clear understanding of the future product. Instead, he stated goals he wanted to achieve. The company management was sure that employees should continuously take psychological tests. There were only some example tests and a desire to get graphical reports afterward.
There was a need in access roles and levels, for example, the heads of departments should have control over testing process deadlines of their subordinates. For example, “The whole department should take the psychological type test by the end of November.”

testing process
The system seemed to need several roles with tasks and privileges. We agreed on implementing Access Control List (ACL) pattern where users have roles and roles own resources. Thus it was easy to add new resources and roles during development of the project.
When we delivered MVP, the client decided to change the project audience. Instead of being used inside one company, it had to be a cloud product for many companies. Thanks to ACL pattern, it was easy enough to rearrange access levels and to add the “Cloud administrator” role.
By that time we had an extensive understanding of the project roles and goals.
Editors created tests and reports for users and administrators. Staff officers managed employees database, sent invitations and controlled the process of test taking. Summary reports were available after all of the staff members had finished the tests.
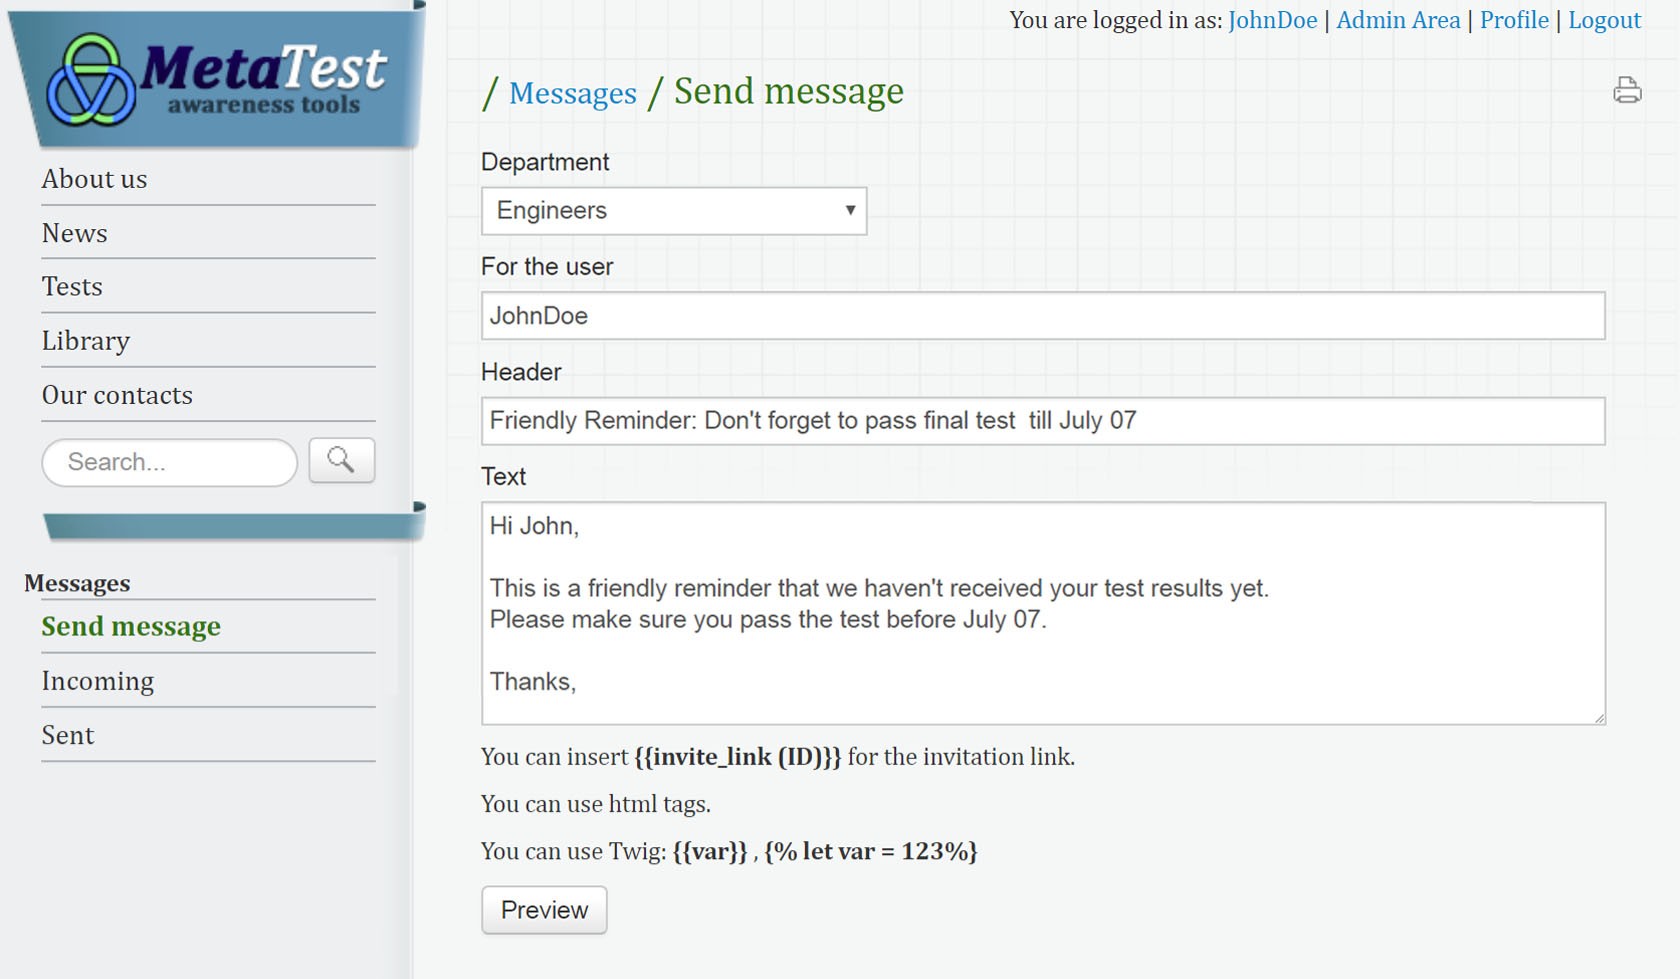
For notification purposes, we added a personal messaging system. Now the administration could send test invitations to single people or whole departments easily. We also sent a copy via e-mail. If that was the employee’s first invitation, we created a new account for him.

personal messaging system
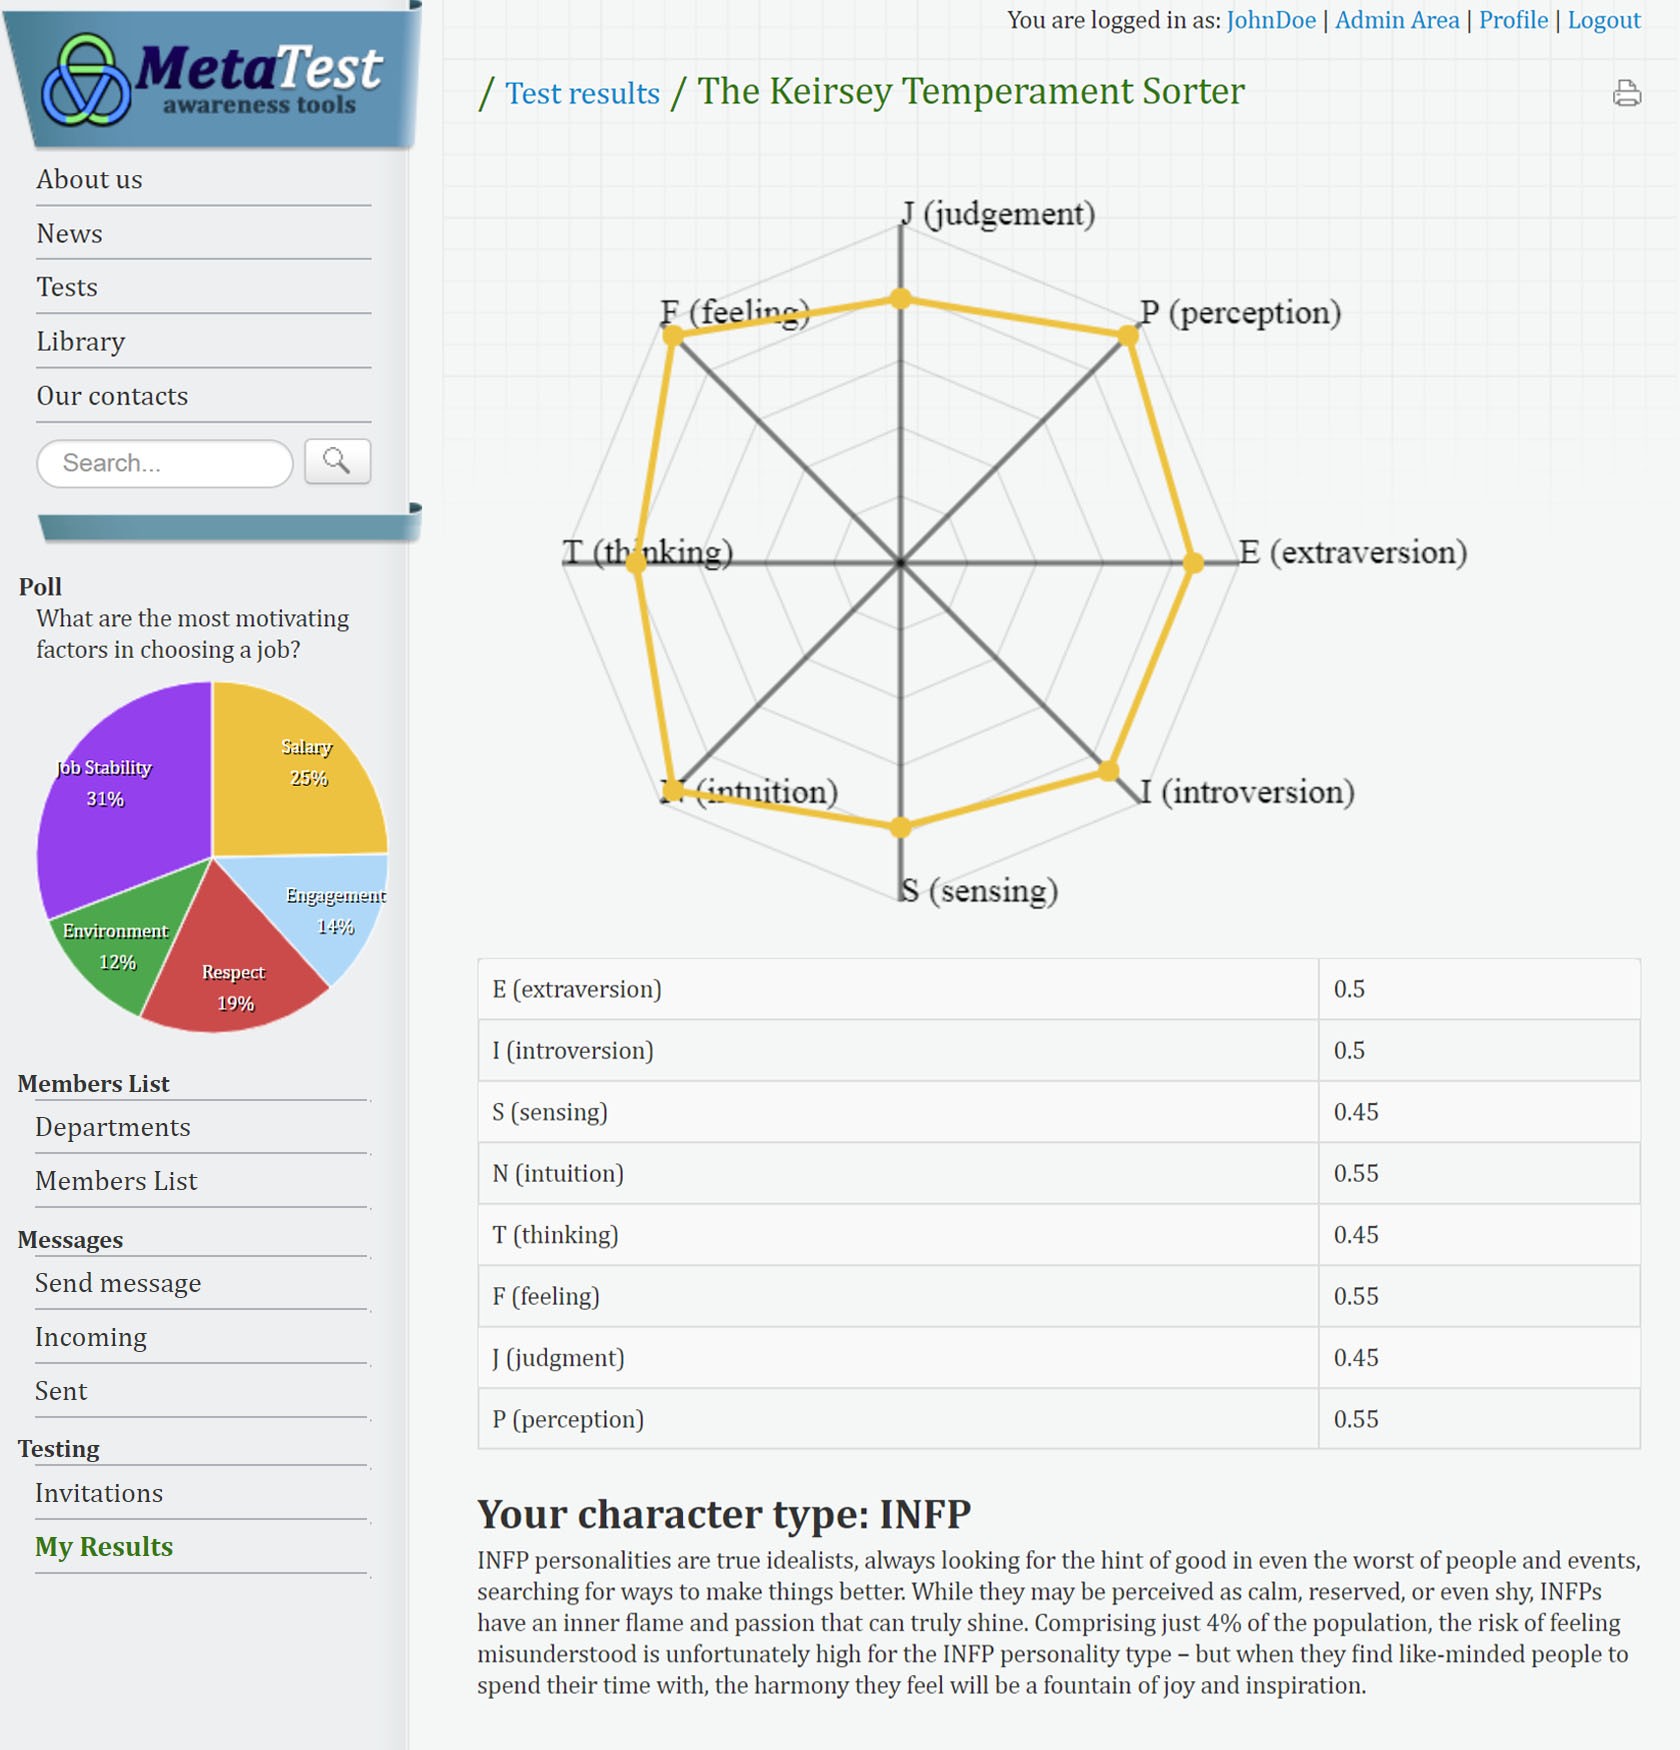
About reports. They had to be extremely flexible with different types of graphs and with the support of statistical math functions. For example, one can show personal motivation question answer only for people that scored 10 points more than average or filter people that are working in a company for more than a year.

graphical report
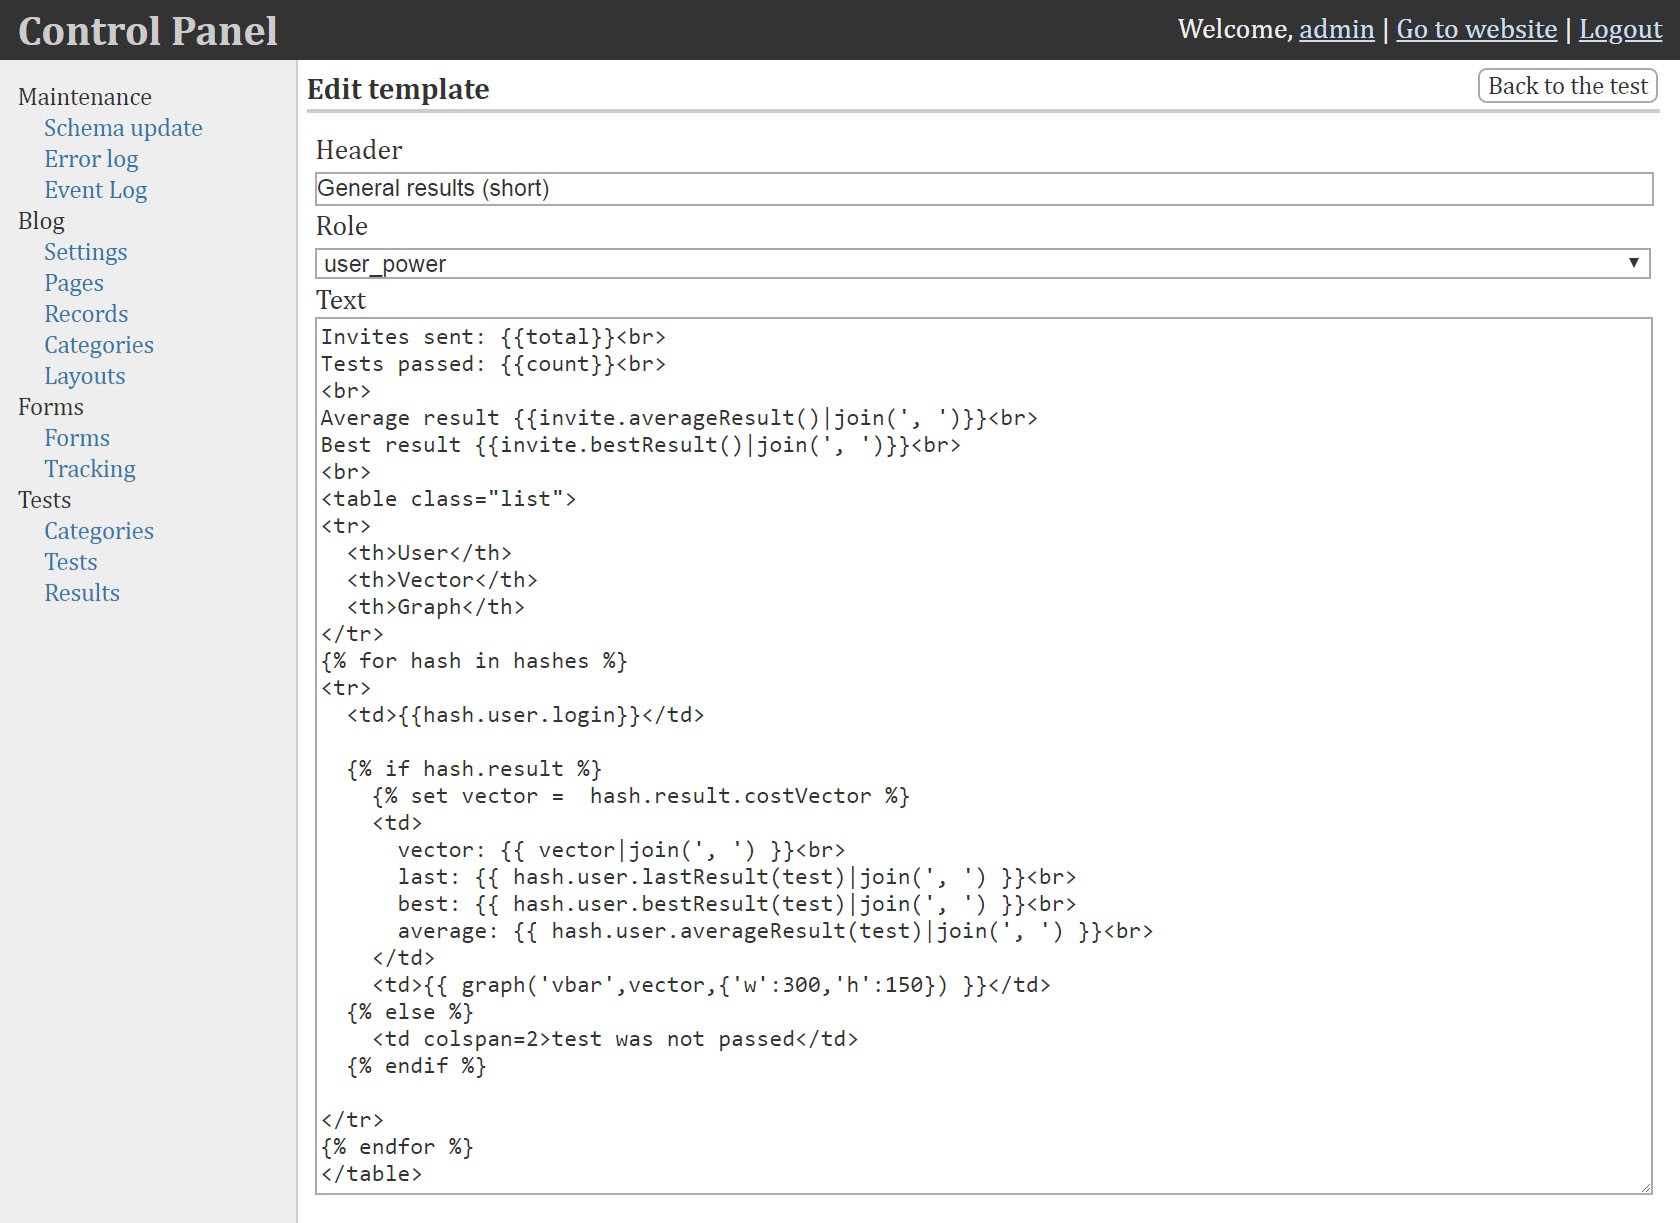
We could solve that by writing code for each specific report type. But we decided to write a unique report creation language, so-called DSL (Domain Specific Language). We used Twig templating engine as a base. Twig is a complete language with conditions, cycles and variables, but it is safe and is working in a sandbox environment.
Then we added functions for graph plotting, tables and statistics calculation. Also, we connected the app data to the report script (user data, answers, scores, averages, dispersion).

DSL-based report template
Then we created the logo and UI design, added some extra features like quizzes on the homepage and banner rotation functionality. As a result, we got a stable and user-friendly product. All thanks to nice initial requirement gathering and agile development process.